Image of the Week: Cuisenaire Rods: Parts & Wholes
May 2, 2021About How Many Do You See?
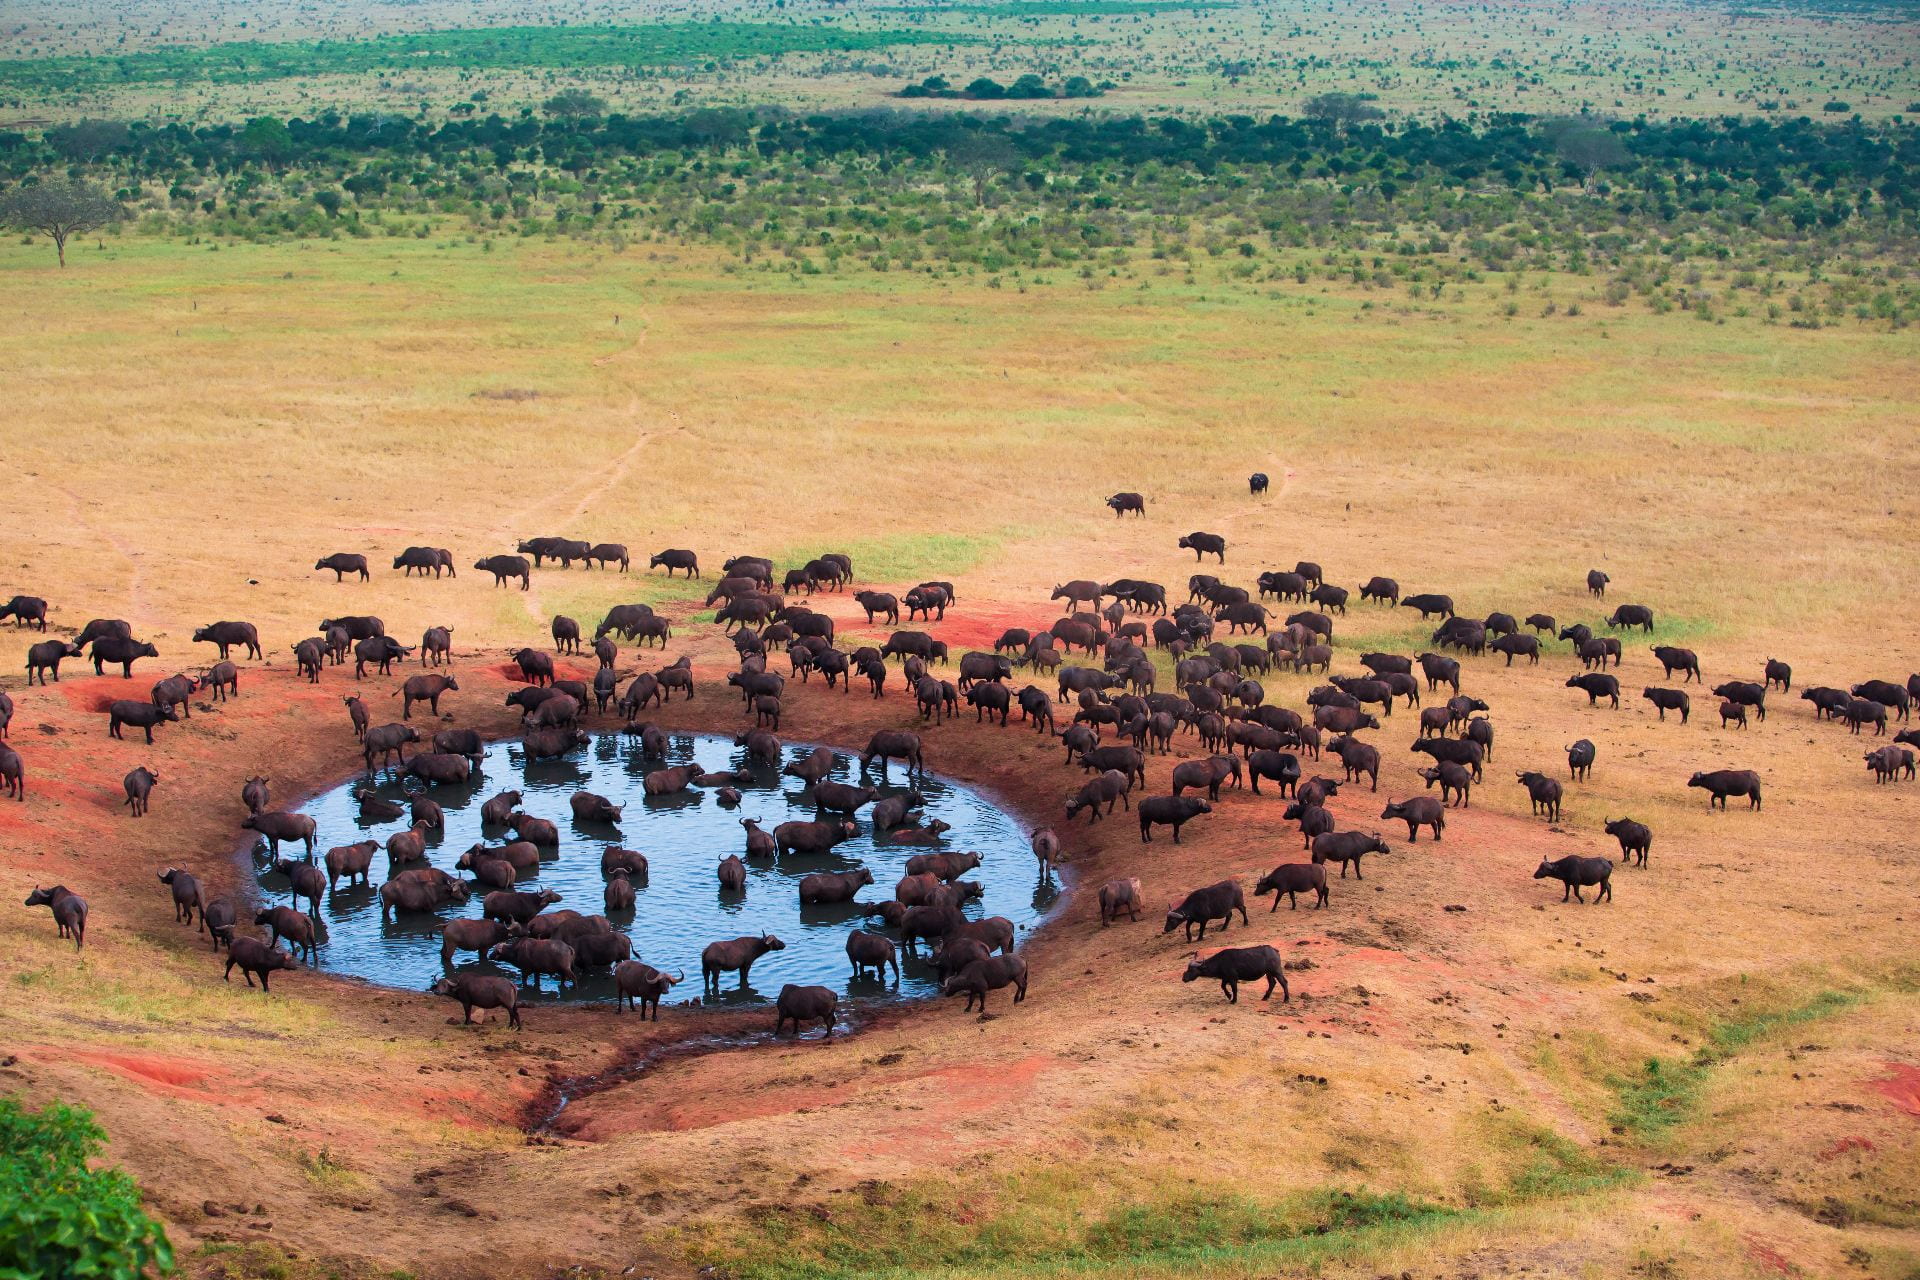
Have a look at the image of the week. About how many buffalo do you see? Pay attention to your own thinking as you consider this question.
- What details in the image are important?
- What benchmarks or references are you using?
- What will you count?
- What parts of the image will you disregard?
Estimating quantities in the real world, like the number of buffalo in this image, involve a number of mathematical ideas and practices, and today we’d like to draw your attention to three: counting a subset, dealing with distribution, and iterating. One thing you’ll notice about this image is that, while it would be tedious and likely involve a lot of errors, these buffalo are countable. They are large and distinguishable enough that one could count the individuals, which means that one tool available for estimating is to count a subset of the animals. You might count one part of the image to answer the question, In this smaller space, how many buffalo are there? Or, you might count a fixed number of buffalo to answer the question, How much space does 10 (or 20 or 25) buffalo take up? Counting a part of the larger group can then position you to deal with the next challenge of estimating: distribution.
The buffalo in this image, as with most objects and animals in the real world, are not evenly distributed in space. In some areas, the buffalo are densely group, in some they are more spread out, and in other areas they are absent entirely. Estimating how many buffalo there are means accounting for these variations. Most students will mentally edit out the areas at the top and bottom of the image where the animals are not shown, focusing attention on the center band around the water hole. But this is an important strategy to draw attention to and help students build on. Doing so can help students to see they might estimate how many buffalo are in the center, closet to the water hole, differently than those near the edges of the image. Give students the word for this phenomenon: density. Having language can support students in grappling with the idea itself.
Finally, students can use these two ideas, counting a subset and recognizing distribution, to iterate. Students can think about area and count, which is the density of the animals, and then ask, How many groups like this smaller one are there in this image? For instance, if students counted 10 buffalo so they could see how big a space they take up, then the question is, How many group of 10 that size do you think are in this image? Alternatively, if students counted a square or patch, then the question is, How many squares or patches like this make up the whole image? In each question, students need to ignore the empty parts of the images and might make adjustments for the changes in density across the image, too.
The estimates and methods of your individual students are fascinating. But this work can become even more interesting when you treat all of your students’ ideas as a data set you can compare. Consider collecting many different estimates and looking at their distribution. Where is the center of our collective estimate? Or are there a couple of different ideas? Why might we disagree or agree? Do different methods lead to different estimates? Which do we think is most accurate, and why?
Are you back in person? Use this activity – or any of our real-world estimation activities – as an entry point for estimate with other set of objects in your school, classroom, or community, particularly those that are not evenly distributed or structured. For instance, you could take a picture of leaves scattered on the playground or dump a bin of blocks on the carpet. Or you might ask, How many books do you think are in our classroom? The more experience students have with trying to coordinate the complex ideas involved in estimating disorganized sets in the real world, the more sophisticated – and accurate – their strategies will become.
And we invite you to follow us on Twitter! Tweet us the fascinating ideas you students have about our activities or how you’re trying these activities in your space. We can’t wait to hear from you!
To multiplicity, cheers!
Jen Munson and the multiplicity lab group
Read the Archive
Get the Image of the Week
Each week we bring you a new image and activity you can do with your students tomorrow, and we spotlight a feature of the mathematical work that we think is important for students’ learning and your teaching.
Stay connected and see what's new.

