
Image of the Week: Organizing and Reorganizing
March 13, 2022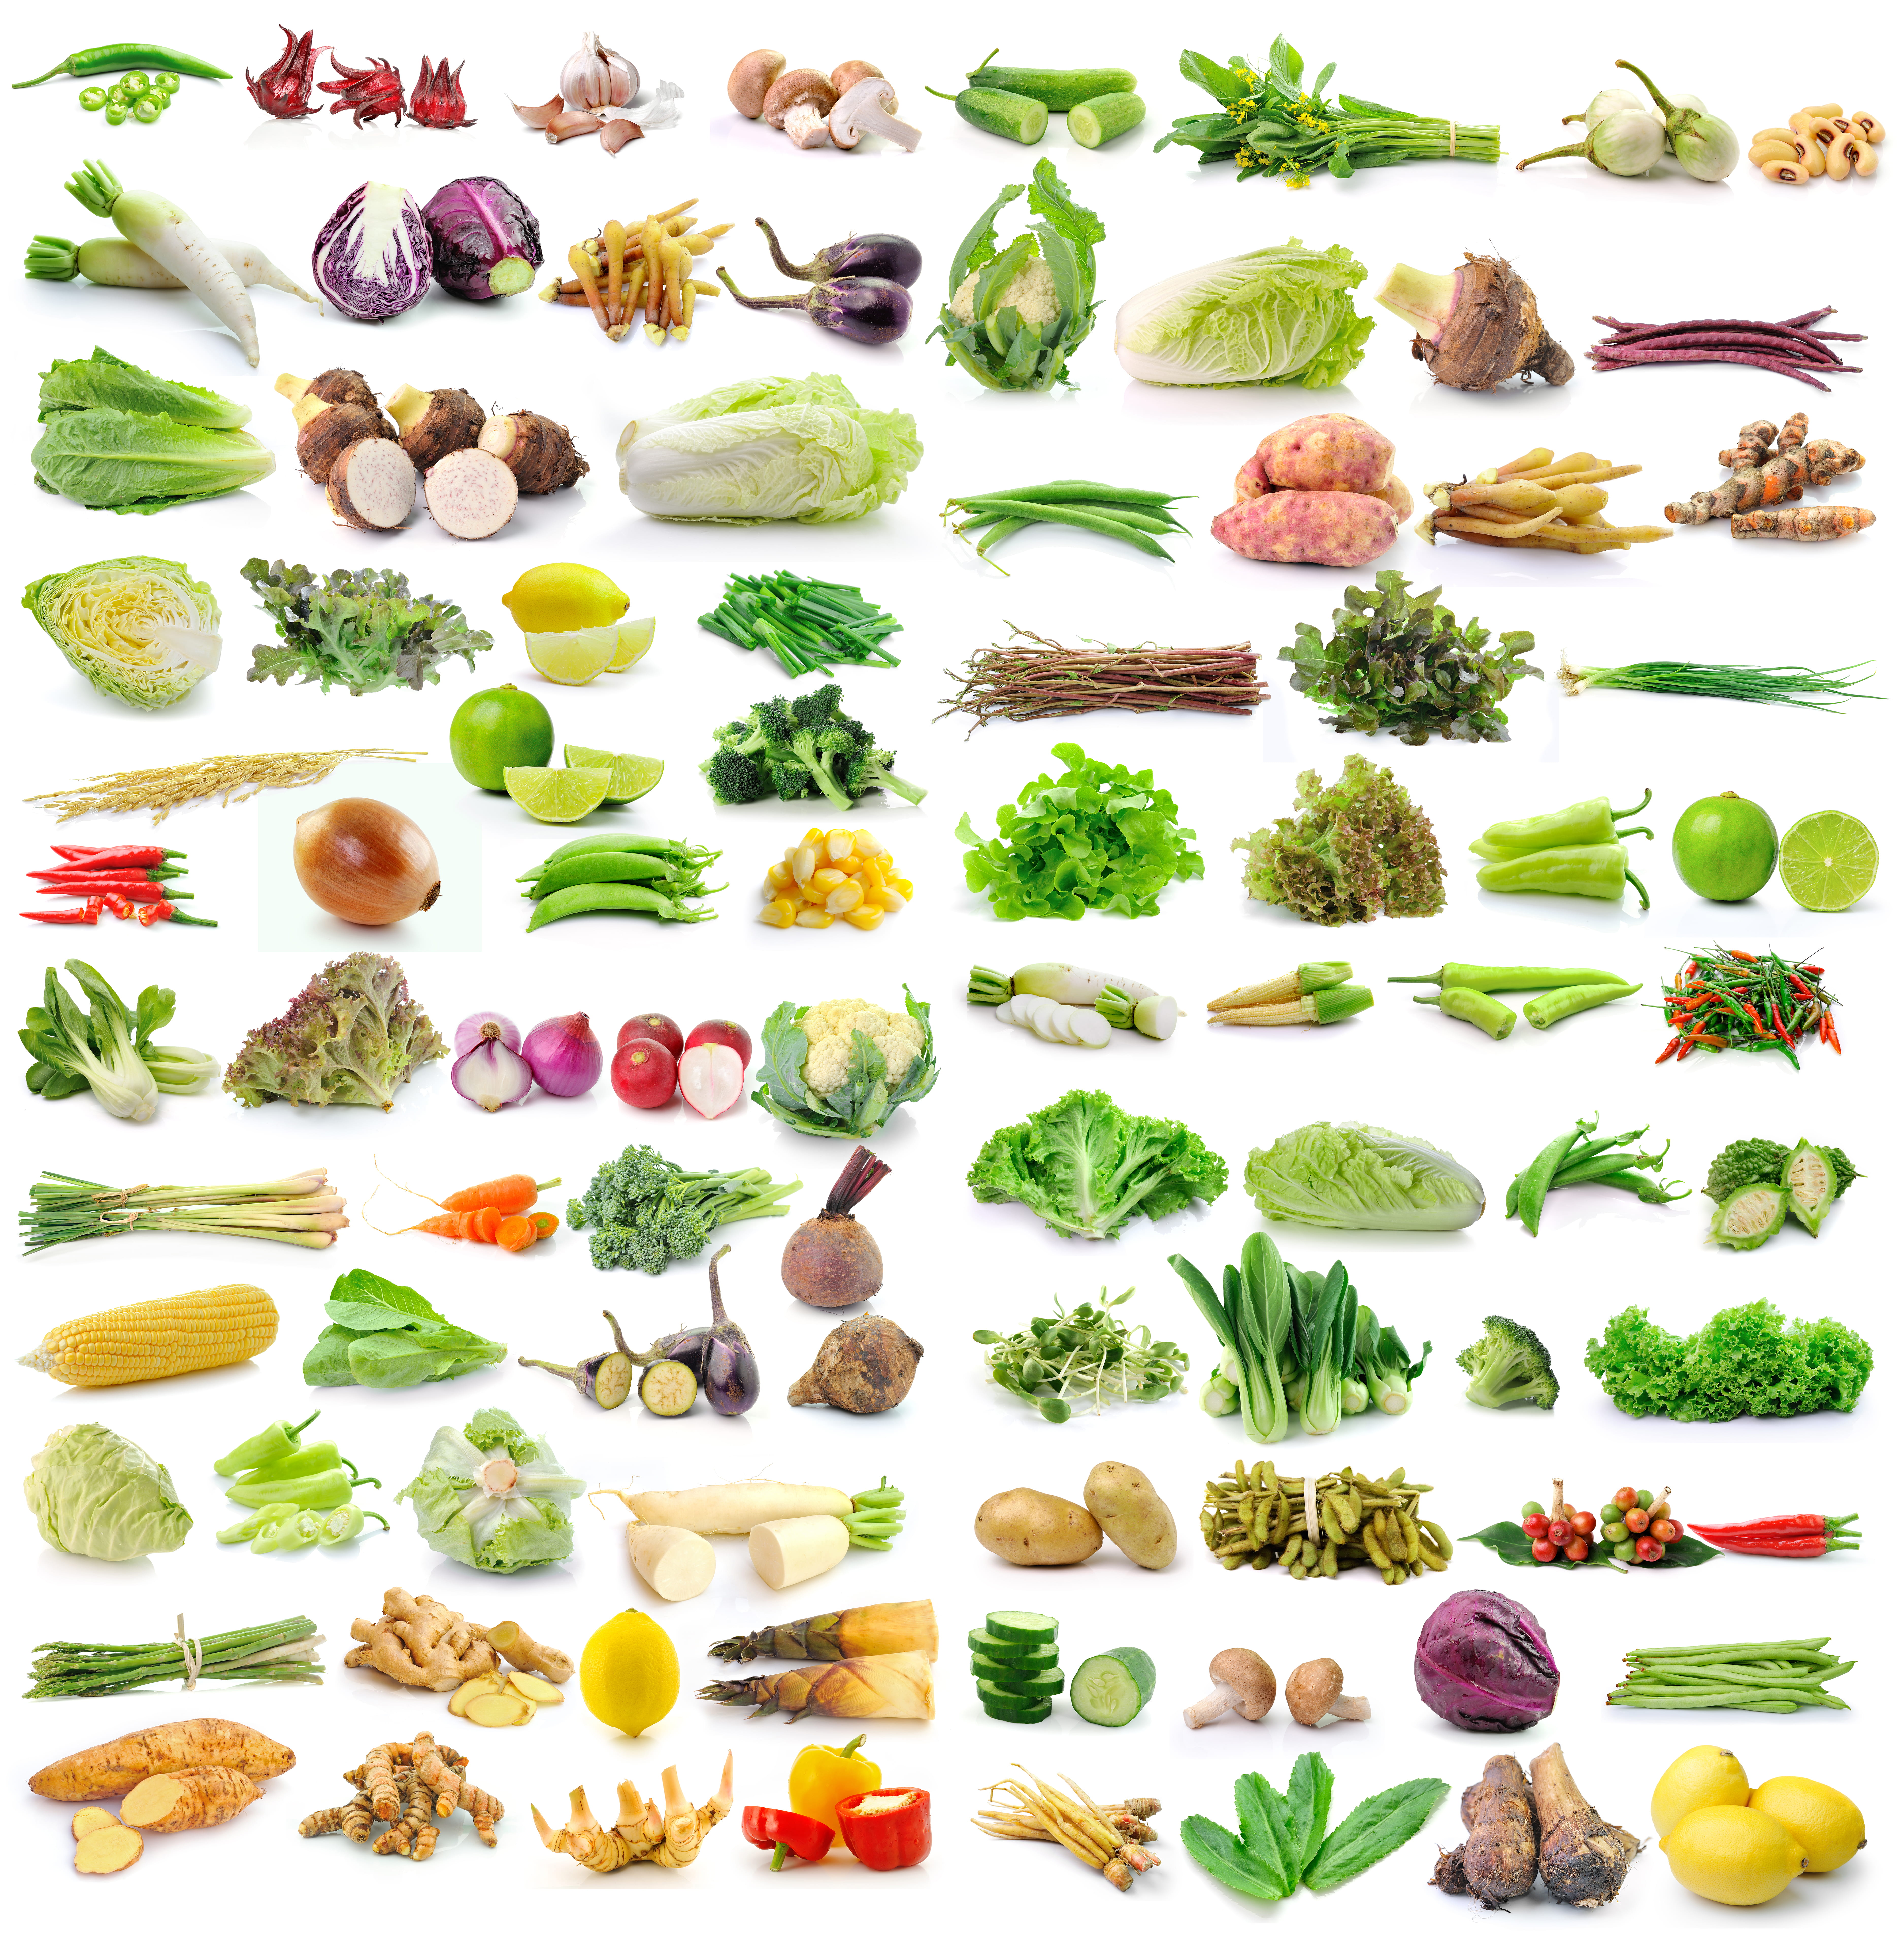
Organizing and Reorganizing
Have a look at this week’s image: How could you organize? To come up with a system, you would first have to notice some of the attributes of these vegetables (and some fruits). Some of those attributes might be easy to see – color, for example – while others might draw on your background knowledge – such as which ones contain seeds or grow under the ground. You could also organize them based on your own knowledge or feelings: vegetables I like to eat and those I don’t, or vegetables I have eaten before and those I haven’t. Regardless of how you or your students organize these vegetables, there are three important points to keep in mind about what children might learn in the process:
- Organizing is the beginning of data science. We’ve written about this before, but it bears repeating. Data is all about organizing information into categories so we can see, count, compare, infer, and, often, predict. Inviting students to develop ways of organizing opens the door to data.
- Ways of organizing can easily become data displays. Students can make columns out of their different groups to compare their quantities and invent pictographs, which are the precursors to bar charts. They can develop ways of organizing that communicate ideas, such as where the vegetables grow in relation to the earth (underground, as a stem, the leaves, or the flowers or fruits) or how likely they are to eat it.
- Any collection can be organized in different ways. This means that students benefit both from seeing other students’ ideas about how to organize and from being challenged to reorganize the vegetables in multiple ways. Seeing that sugar snap peas, for instance, might fall into the “I like to eat it” category, but also in the “green” category and the “contains seeds” category and the “sweet” category, help students build complex and multilayered ideas about objects as having many attributes. Further, as we change the ways to organize, different vegetables end up together. In this example, the hot peppers also belong to the “contains seeds” category but not to the “sweet” category. Depending on how you organize, the sugar snap peas and the hot peppers might be grouped together, or not.
If possible, print out the pdf version of this image for your students so they can physically cut the vegetables apart, make groups, tape or glue them down, and create data displays. If you have time, allow them to do this in different ways and then do a gallery walk of your students’ data displays. Ask, What do you notice? What do you wonder? What did you learn from the different displays? What surprises you? They might learn about vegetables, mathematics, and each other.
And we invite you to follow us on Twitter! Tweet us the fascinating ideas you students have about our activities or how you’re trying these activities in your space. We can’t wait to hear from you!
To multiplicity, cheers!
Jen Munson and the multiplicity lab group